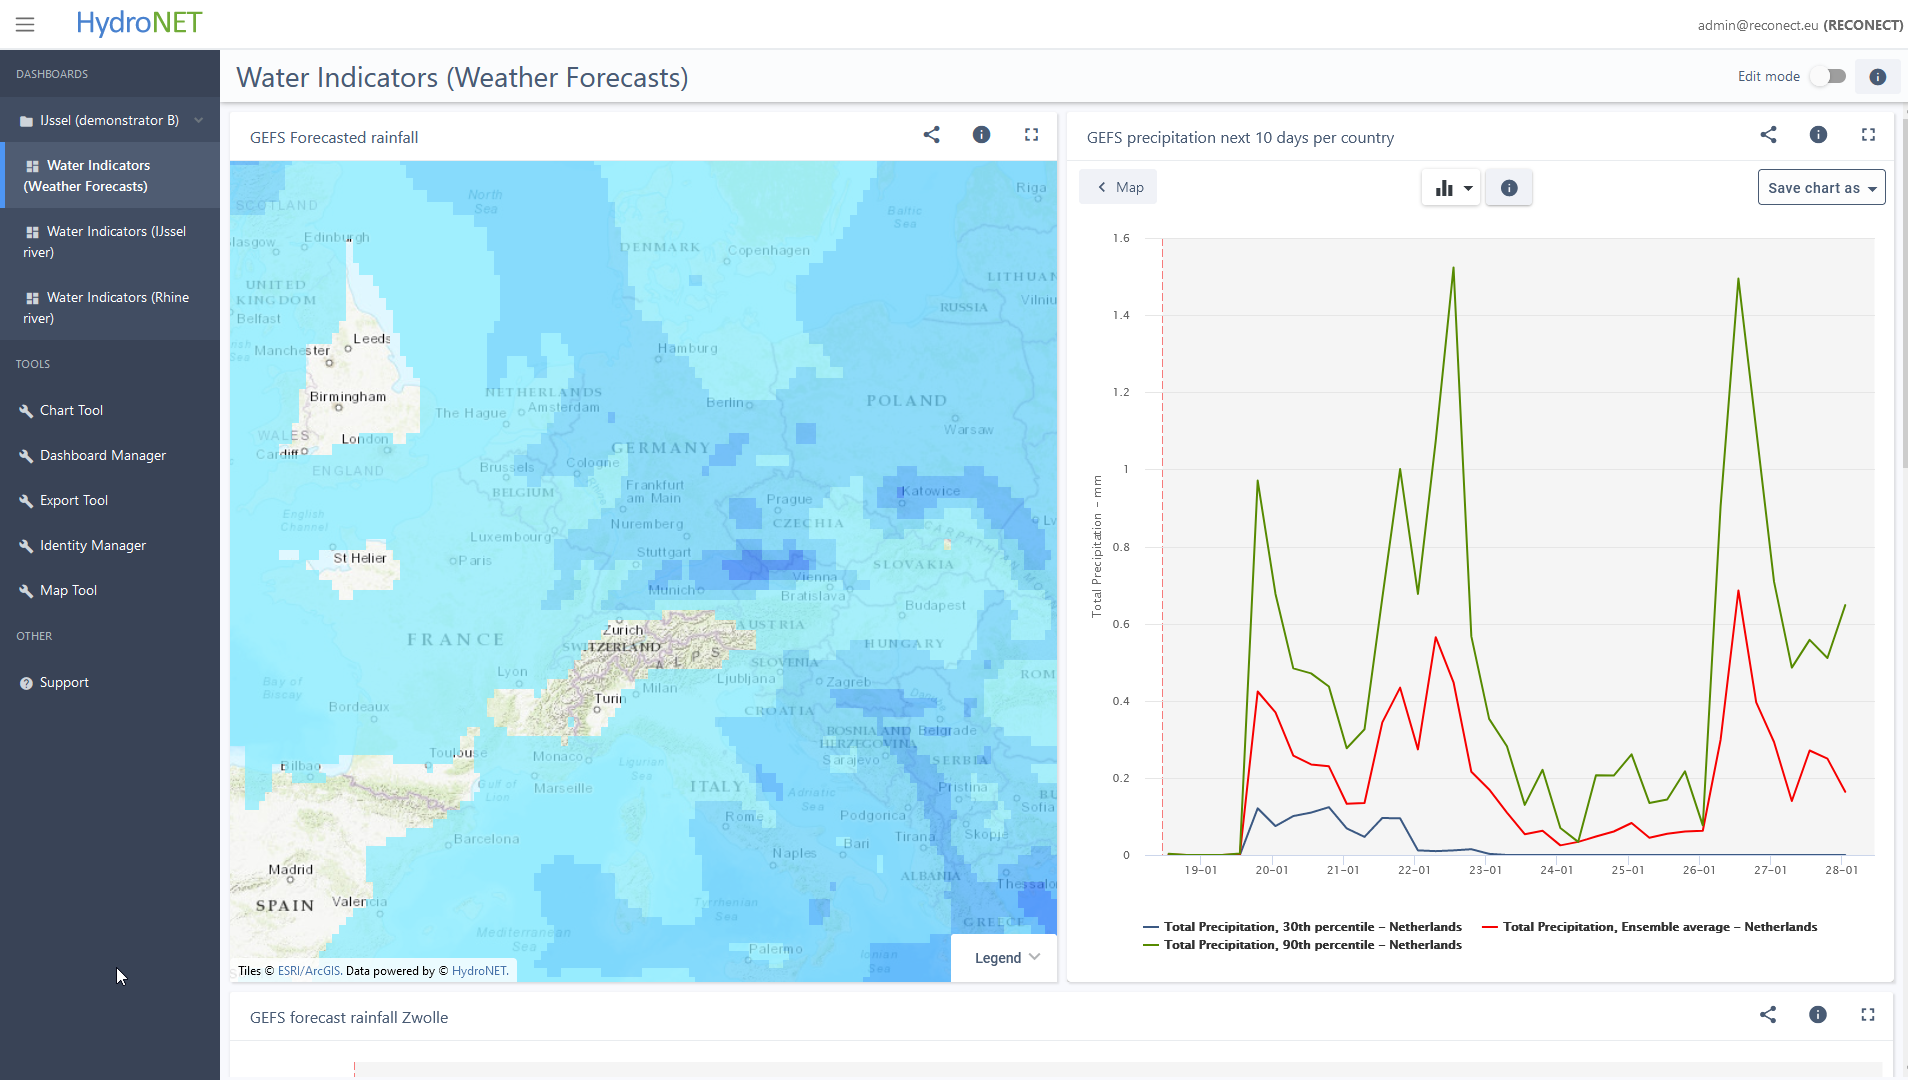
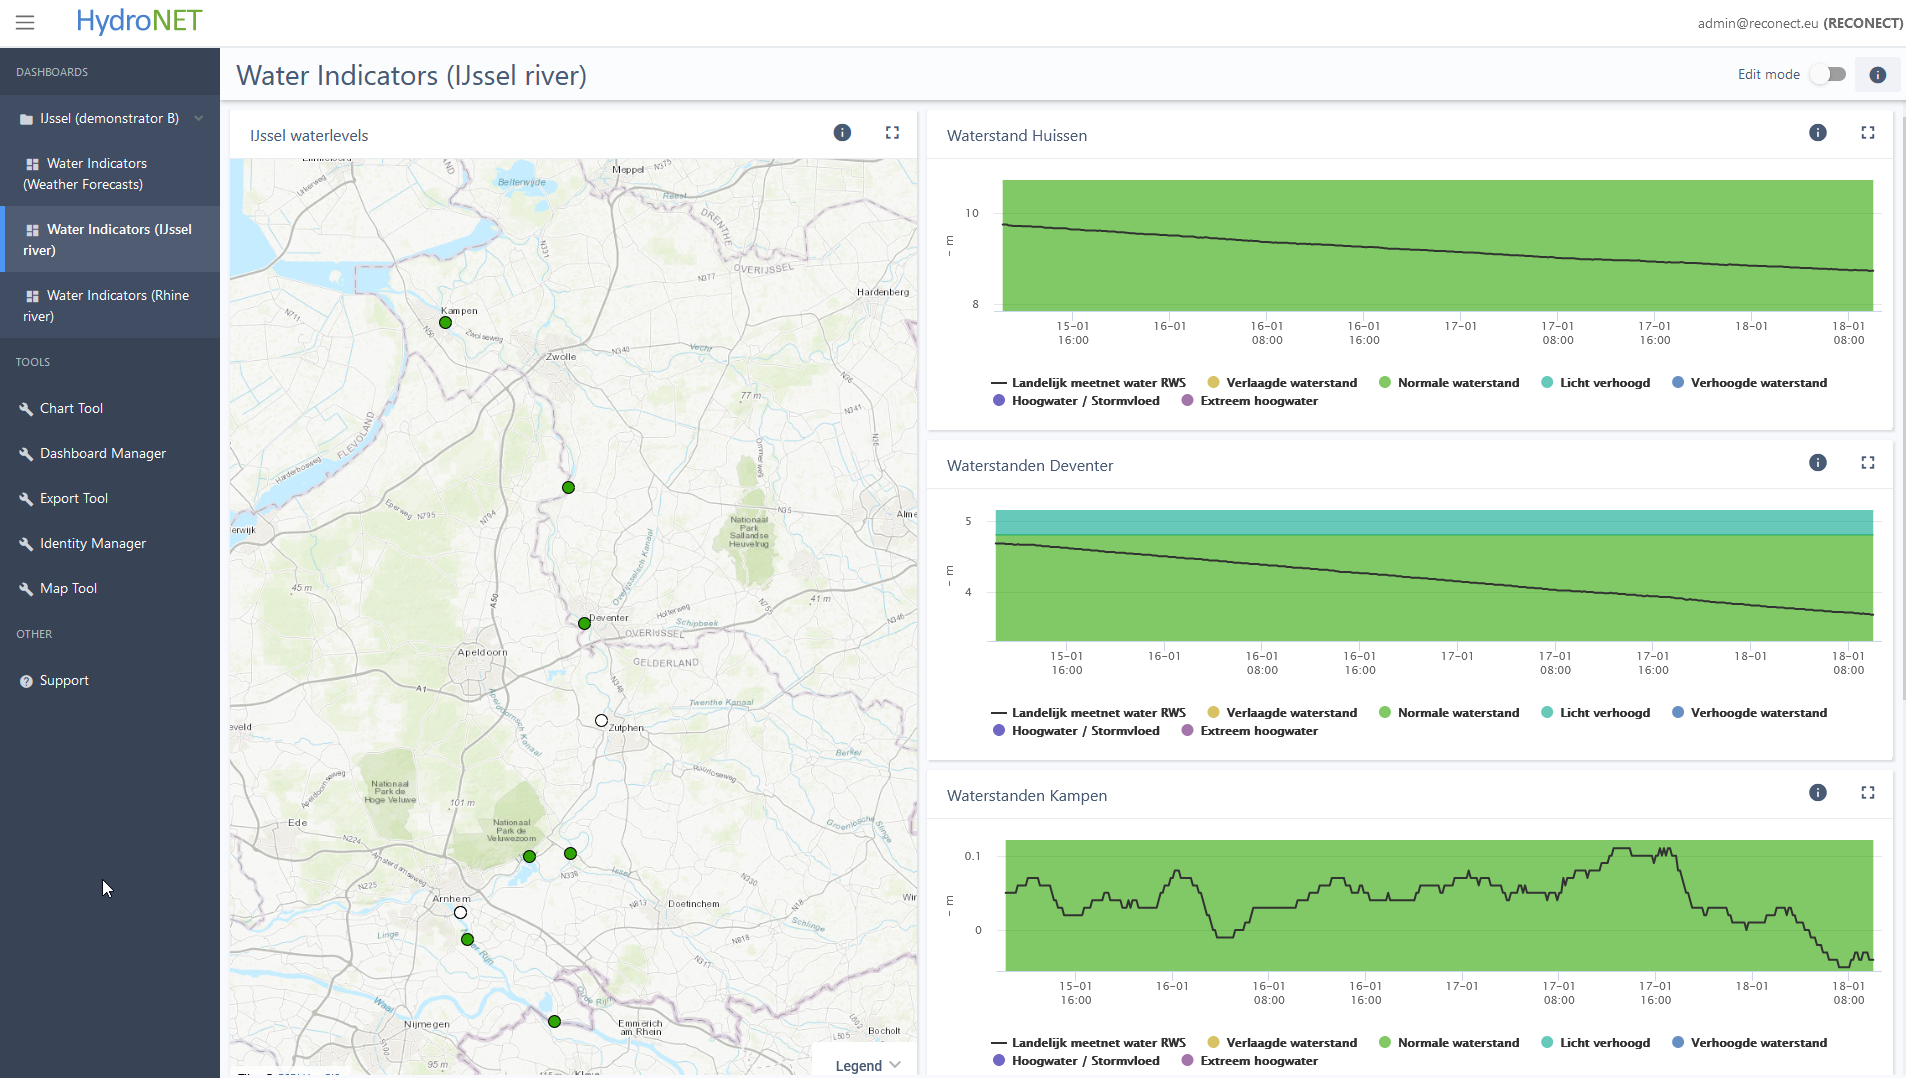
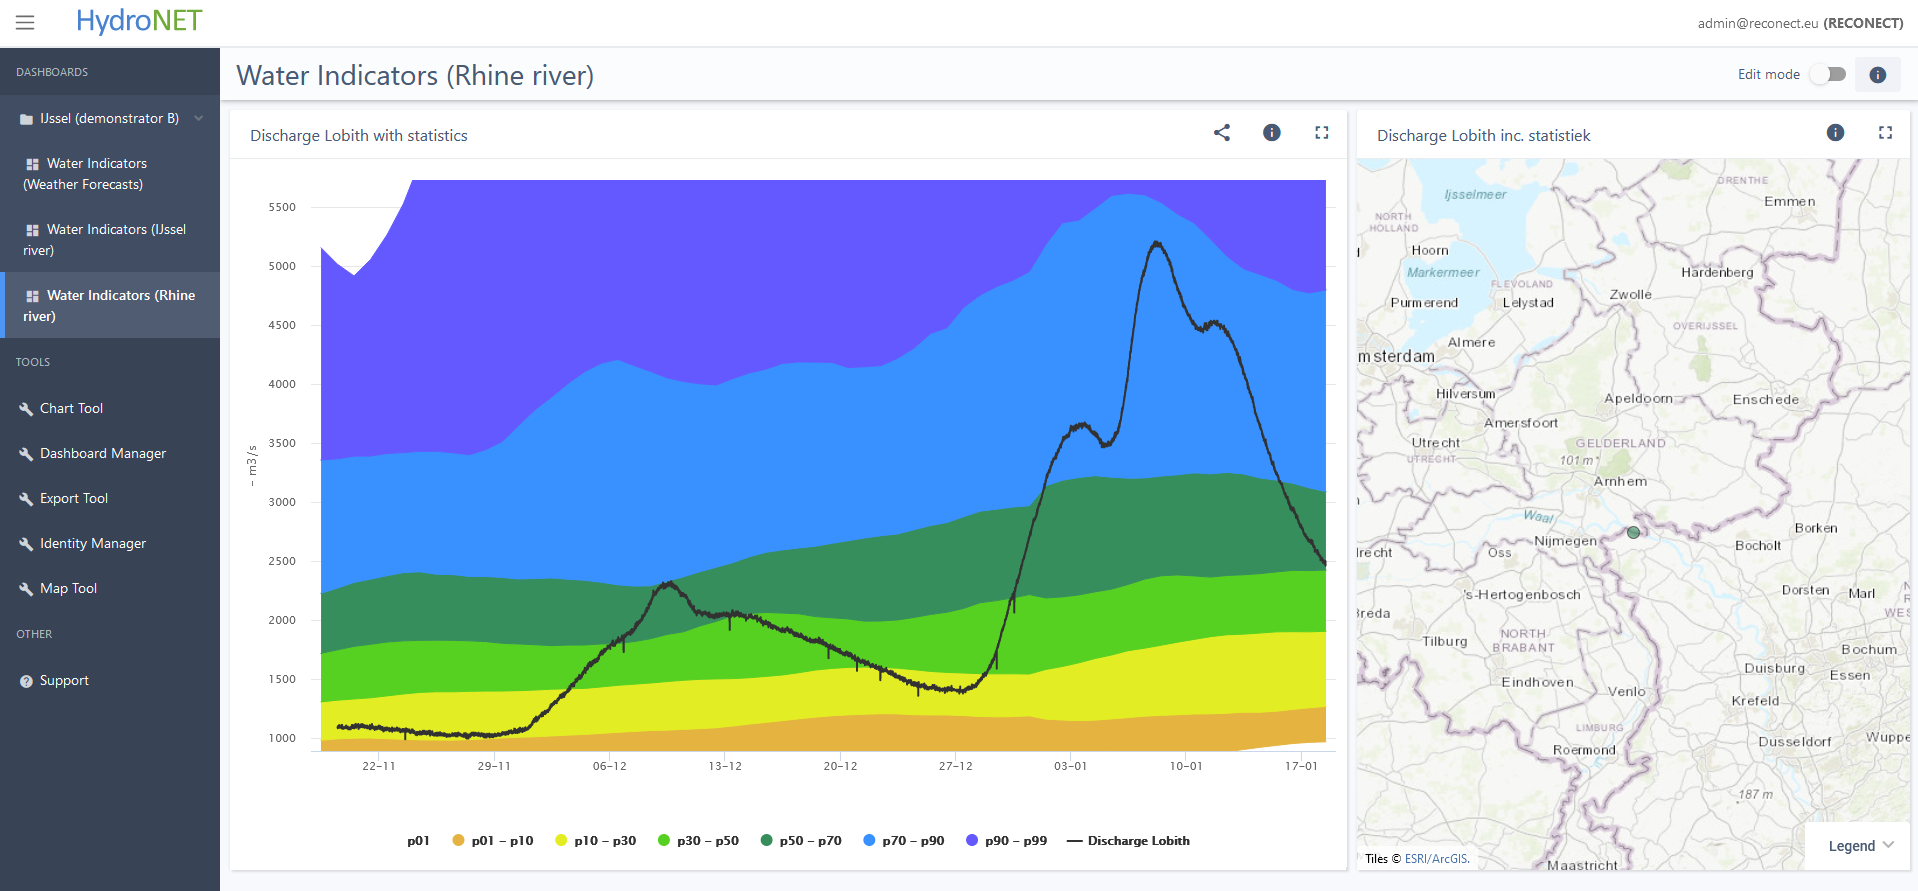
The HydroNET dashboard is an expert platform for weather and water data aimed at water professionals. It provides several visualization and analyses tools for weather and water data. For example water levels and flows can be compared to known thresholds such that the output can be visualized using traffic light colors.
The platform is aimed at professional users (i.e. operational water management) by providing personalized dashboards with relevant information. Within the RECONECT project a dashboard has been created for the Ijssel demonstrator case.
A link between the central TeleControlNet and HydroNET platform has been established such that in-situ data is available. These in-situ measurements of water levels and flows are combined with weather forecast data in order to provide dashboards for the water indicator of the IJssel case.
The HydroNET platform for the IJssel demonstrator is available for RECONECT guests. Support and more information is available at helpdesk@hydrologic.com
Click to get guest account credentials
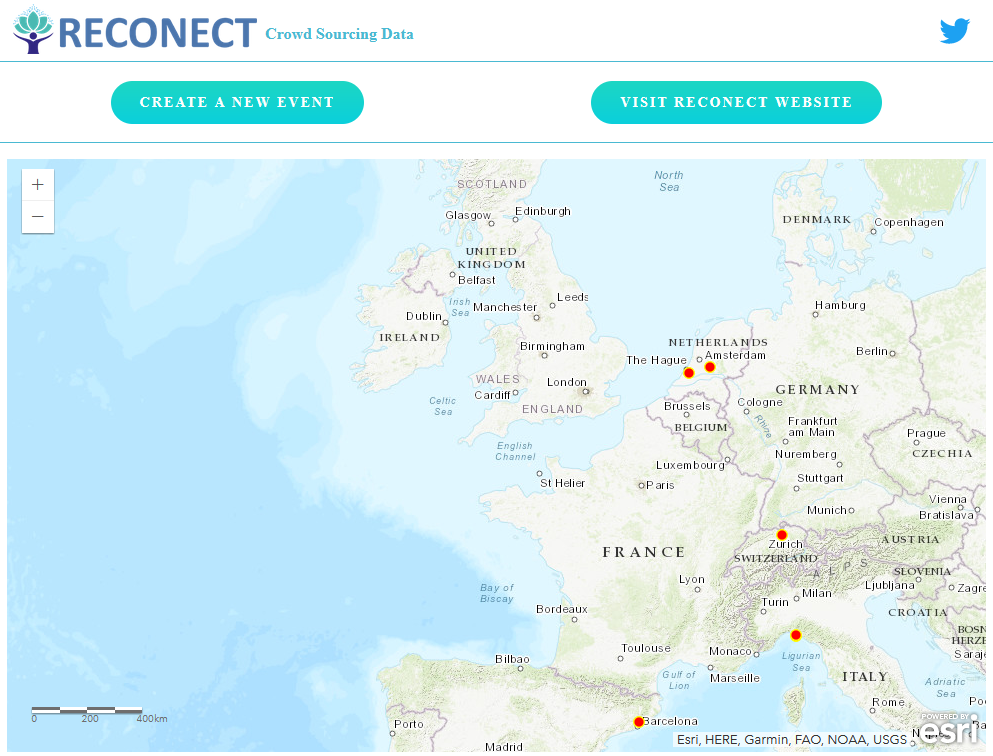
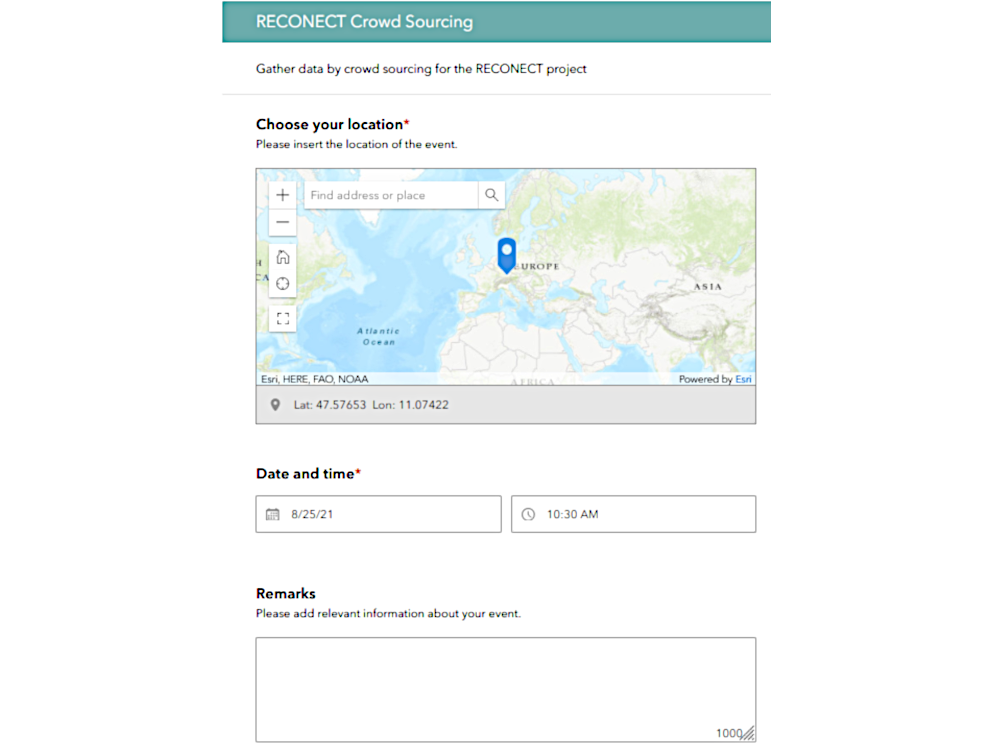
MMonitoring of NBS can be done with sensors, but also with the help of crowdsourcing (citizen science). In order to facilitate the collection of information by citizens, a simple web-based crowdsourcing application has been developed by HydroLogic Research. Any person can send in a report. A report can have a photo a description and a location. This allows any person to log relevant information. This information can later be displayed in the HYDS platform.
Any user can create a new report. For example a visitor in a national park might spot a leak or overflowing channel. This person can open the website to enter a new report in which he can enter the location (via GPS or manually on map), a description and even add a photo.

